Click HERE for a LINK to all of my charts and positions.

Gold looks like it found its bottom at the end of 2016 and has since become a good physical, durable store of value. Holding a small portion of your net worth in physical gold coins and bullion is a great idea – especially in these weird as fuck times.
This GLD chart is NEUTRAL for the stock market in 2019.
GLD 2019 prediction: UP
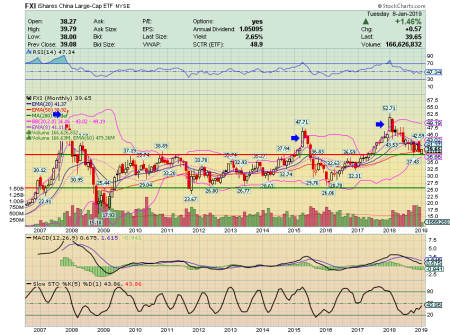
This China chart tells me we probably have more downside to come, if this unwinding is similar to the past two. This is the scariest chart in my mind. The $1000 question: Will 2019 be more like 2015? or 2008? Or has China figured out how to smooth and shorten these swings? Honestly, if I history repeats itself, a repeat of 2008 looks 50% possible. This FXI chart is BEARISH for the market in 2019.
FXI 2019 prediction: DOWN
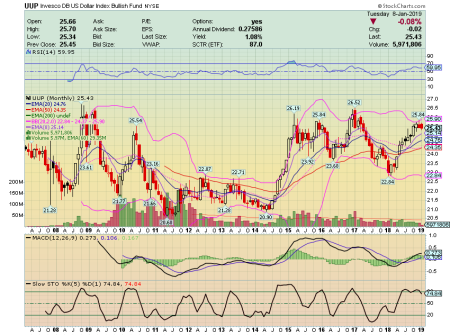
The dollar chart makes me feel better about the prospects for large cap Dow stocks, as a weakening dollar will translate into higher profits for the multinationals. BULLISH for large cap multinationals in 2019. Note that in 2008, the dollar was very weakened before the market crashed. In 2019, we have a strong dollar and are in a better position to nip any bearish tides in the bud. This UUP chart is BULLISH for LARGE CAPS in 2019.
UUP 2019 prediction: DOWN

This TLT chart shows how interest rates have normalized. Reminds me of a ship that used to be keeled over on its zero interest side but has now been righted by the fed. This TLT chart is more bullish than bearish for both STOCKS and BONDS in 2019. Note the neutral RSI, the neutral MACD, and the NEUTRAL stochastic.
TLT 2019 prediction: NEUTRAL
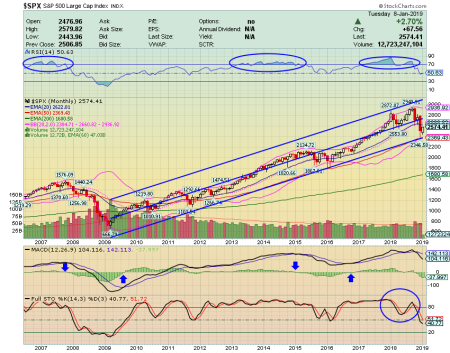
Notice how perfectly the highs and lows bounced off of their three standard deviation bands. It’s BULLISH right now. As long as we don’t break down below the lower band, this looks like an excellent time to WAIT AND SEE in January 2019, then accumulate stocks if the “bottom” retests and holds successfully.
SPX 2019 prediction: Volatile, bottom testing first quarter, spring rally, sell in May and go away, christmas rally. Full year: ultimately UP.
Click HERE for a LINK to all of my charts and positions.


 Posted by Alex Nason